We are pretty much towards the end of a bear market in terms of wave counts and these are times to accumulate blue chips, not sell, says Sonali Ranade
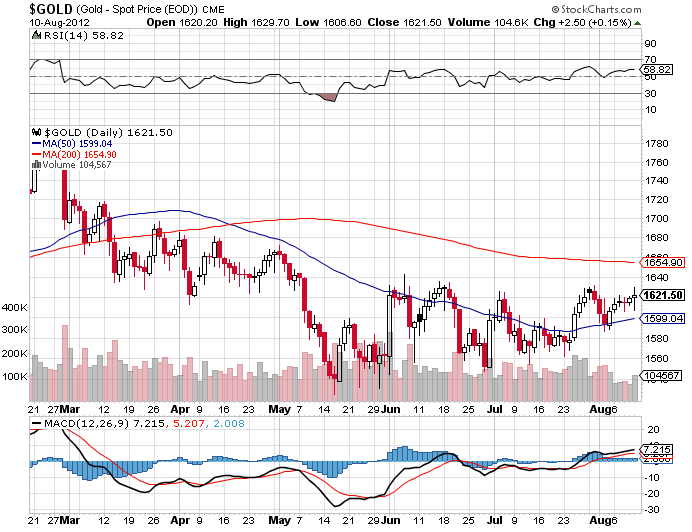 GOLD [$GOLD]: As mentioned last week, gold was expected to continue its pullback to the vicinity of $1660 area on the charts, which it did all through last week, closing the week at $1617.14 after making a high of $1626.
The pullback can continue next week. The metal's 200 DMA, now sloping down, is in the $1650 area while its 50 DMA is at $1600, with the metal price sandwiched between the two. The pullback over the ensuing week could test $1650 or even attempt a false breakout to the top. It is unlikely to convince anybody but the most gullible.
Wave counts show gold continues in a fierce bear grip. The last leg of the correction down can begin anytime after the next week or two. Investors should avoid going long in the metal for now. The downside target for the last leg of the correction could be much lower than $1550.
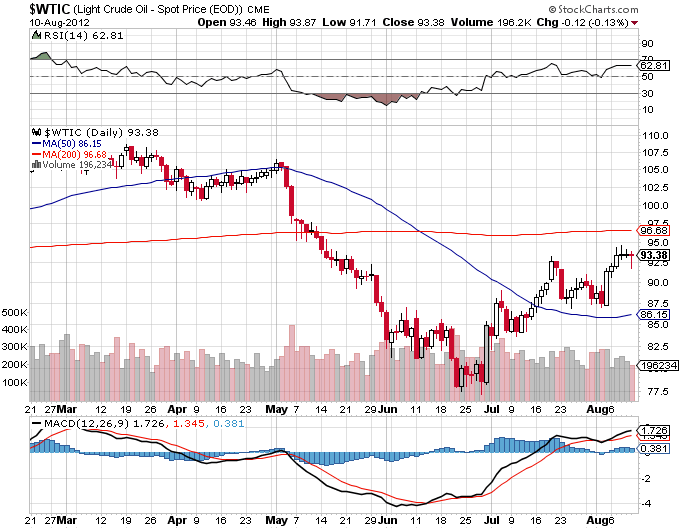
Crude [$WTIC]: WTI crude is in a very strong upswing in the early stages of what promises to be a fairly stretched out rally from its recent low of $77.50.
Crude closed last week at $92.87 after having made a high of $94.72, which was a notch above its 200 DMA, which currently stands at $93.60. The fact crude did not hold above its 200 DMA is hardly material at this stage since such things take more than three or four attempts usually. Crude could find support on the way down around its 50 DMA, which stands at $89.25. Crude is unlikely to get there and may rally much before that in an attempt to take out its 200 DMA again. Crude remains a buy at all dips.
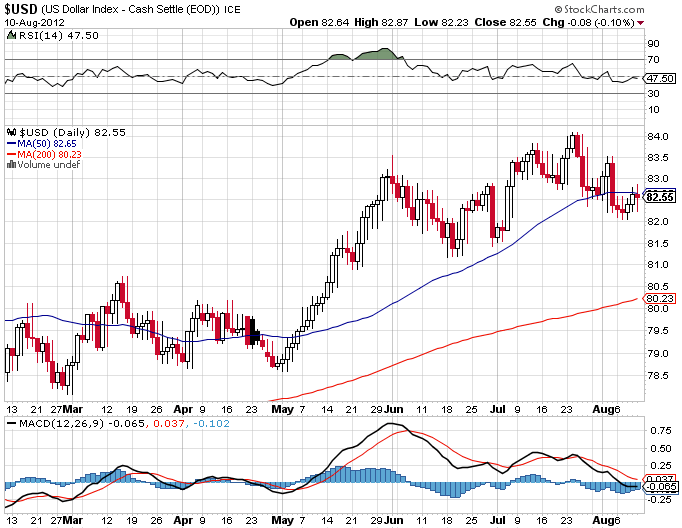 Dollar Index [$USD]: The US dollar has been correcting since its recent high of 84.10 made on July 23. It The US dollar has been correcting since its recent high of 84.10 made on July 23, It closed the last week at 82.63 just atop its 50 DMA, which currently stands at 82.5480.
The dollar's 200 DMA is at 80.618 and in the current correction this area could be tested over the next two weeks. The support is unlikely to be breached given the dollar's long-term bullishness. On the other hand, a rally beyond 83 to the topside is unlikely.
Dollar would be a strong buy in the vicinity of its 200 DMA. The 81.50 area is also a region of strong support for the dollar. Position traders should look for drops to supports to buy.
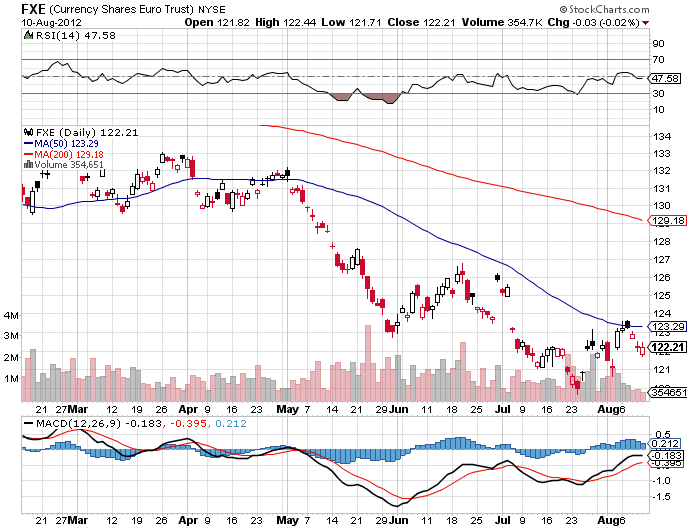 Euro$ [FXE]: The euro's failure to rally beyond 1.2750 in June betrayed great weakness in the currency. It has been correcting since then and made a low of 1.2040, where it found support and rallied to 1.2450. Euro closed the week at 1.2289.
The counter-trend rally in the euro, jagged and weak as it is, is not over yet in my opinion. The euro could find support around 1.2200 and attempt a rally from there to 1.2450 and perhaps even beyond that. However, any rally in euro would be short-lived and subject to violent corrections. While not bullish on the euro, shorts should be avoided until the downtrend resumes and is confirmed.
$-INR: The dollar continued to consolidate in the Indian market between 55 and 55.50 over the last week. It closed at R55.28.
 My wave counts indicate the dollar should rally from these levels to retest 57 in the near future. Note that all through the current correction the dollar has tested the 54 region only once. I would have liked to see a more rigorous test of the region.
The probability of retest of 54 has now receded in terms of time. The dollar remains a buy at all dips in the Indian market.
A fall below 54.25 would invalidate my analysis. A break above 56 will almost certainly confirm the prognosis. Expect big moves towards the end of the week.
S&P 500 [SPX]: The S&P 500 index closed last week at 1405.98. As expected, SPX cleared the 1390 resistance level fairly easily and then had a shy at 1405 level. The next resistance lies at the previous top of 1422. Will that be attempted and taken out over the next week or two?
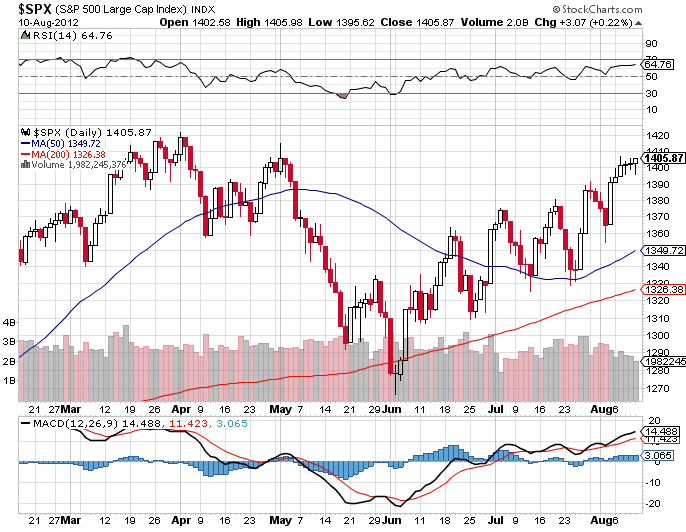 Wave counts indicate two things quite clearly. Firstly, there is little scope for the SPX to go anywhere beyond 1420 at this stage. It could take a shy at that level but what lies beyond that? Secondly, in terms of time, the rally from the recent low of 1266.74 is almost exhausted and a correction is due any day now.
In my opinion, SPX is now toppish and traders should look for opportunities to establish short positions at every rally with a stop-loss placed in the 1425 to 1430 region.
Sensex [$BSE]: The Sensex's 50 DMA once again pierced the 200 DMA on the daily charts generating a bullish buy signal. It has given such signals before that turned out to be false breakouts. Is it real this time?
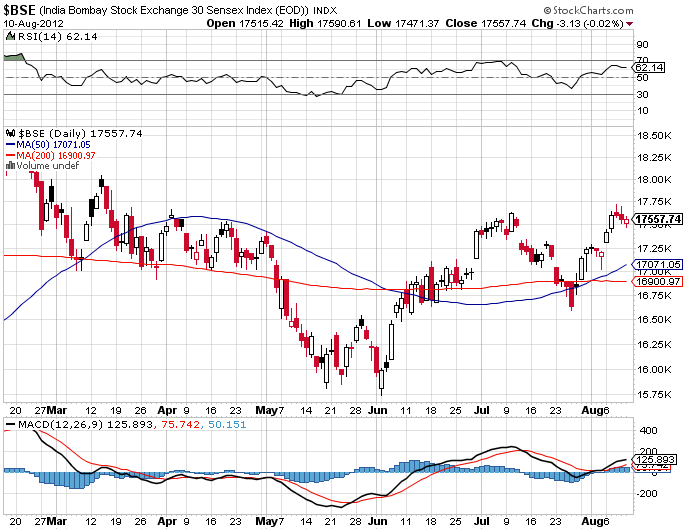 In terms of wave counts, the signal could be spurious. The Sensex could continue to correct over the next week. It has multiple supports spanning between 17,000, 16500 and 15,500.
How far down the index goes is impossible to say. Ideally, one would like to see it go all the way to 15,500 before September-end. That may yet happen. On the other hand, the market could stop short of that mark and stage a rally to 19,000 and then come down over a stretched out correction that follows. The latter would give the market more time to catch up with fundamentals.
Either way, am not particularly bullish on the market overall. But it bears noting that we are pretty much towards the end of a bear market in terms of wave counts and these are times to accumulate blue chips, not sell. Look for buying opportunities without chasing stocks.
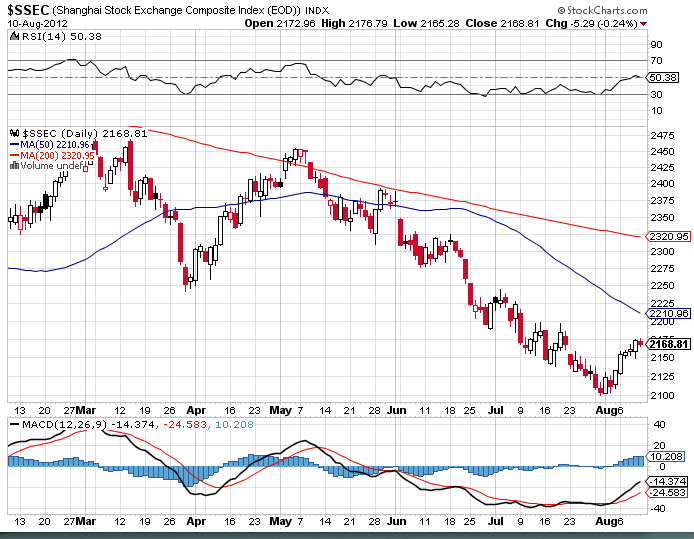 Shanghai Composite [$SSEC]: The Shanghai Composite Index turned up from 2100 instead of the earlier low of 2130 more or less indicating that the Chinese market has put in low in that region. The index closed the week at 2168.81.
The index has time enough to come back and retest 2100 before the end of August and could well do that over the next few weeks. On the other hand, its 50 DMA stands at 2205. That would be the first major resistance to cross in a rally. It may be time to accumulate Chinese blue chips as well.
NB: These notes are just personal musings on the world market trends as a sort of reminder to me on what I thought of them at a particular point in time. They are not predictions and none should rely on them for any investment decisions.
Sonali Ranade is a trader in the international markets


 © 2025