Exciting times ahead in the FX markets, predicts Sonali Ranade
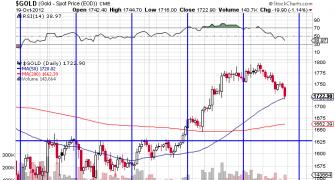
 Gold: The yellow metal has been in a counter-trend rally from its low of $1674 marked on November 2. The counter-trend rally can go all the way to $1800. However, the more interesting question for long-term investors is the likelihood of gold coming back to $1674 or below the trend line running from the low of $681 in October 2008 to the lows of $1571 in July this year.
In other words, will we see a leg down after the current rally to $1800?
Given the length of the drop from $1780 to $1680, and the subsequent counter-trend rally, I think gold may see a failure of the terminating C and the correction that follows this rally to $1800 may not do more than test the long term trend line cited above.
So long-term investors should now be looking to buy gold at dips with stop-loss at $1680 from here to the end of January next year. Not bearish on gold for the long-term anymore.
 Silver: The metal made a low $32.16 on November 1 and has been in a counter-trend rally since then, closing the week at $34.04.
While silver could rally to $35.50, the likelihood of its doing so is not very high. Instead silver could drift sideways for a while before coming down to test the $31 region.
Silver's entire move up from the low $27.19 made on May 16 appears reactive and the move down from $35.50 is correction to the rally from the lows of May, which hasn't been completed yet.
 WTI Crude: Crude closed the week at $87.68. Crude has been in a correction from the high of $113.89 in May 2011. Counting the waves from that point, in my opinion, the low of $84.05 on November 7 marked the end of the correction and fall to $78 may not happen in the near future.
If my wave count is correct, crude should see a jagged intermediate rally from current levels to the $100-110 region over the next six months. The nature and extent of the "jagged" character will tell if crude has resumed its long-term uptrend or if we are in for some correction after June 2013.
A break and consolidation above $89, which is crude's 50 DMA, will be confirmation of the above wave count. Bulls may keep a stop loss just under $84.
 US Dollar: As expected in the post last week, the $ Index [DXY] turned down from the region of 81.20 and closed the week at 80.2360, well below its 200 DMA and a touch above its 50 DMA.
With the fall below 81, the counter-trend rally in the $ in force from the low of 78.60 on September 14 this year is over. We can now expect the $ to gradually drift lower to retest 78 by the end of December. Expect a consolidation below the 200 DMA [81] before the decent commences in earnest.
However, the $ Index may not traverse all the way to 78 as the long-term charts favour continuation of the bull run in the $.
 Euro$: The Euro$ above 1.28, followed by a close above 1.29 on Friday at 1.29750 could portend considerable volatility in FX markets. We can now expect the euro to back off a bit and consolidate above the 1.28 mark before moving up towards the 1.31 region.
A failure to penetrate the 1.28 level in the ensuing consolidation effectively means the euro could rally to 1.31 before the middle of December. Should that happen, all talk about the euro retesting the 1.20 level in the near future will evaporate. Hence the ensuing consolidation and the following rally are crucial for the long-term trend in the euro. Exciting times ahead in the FX markets. Note, the $ index will be correcting down during this period and gold moving up! That's an interesting combination!
 $-INR: As expected, the $ rose against the INR, making it all the way to the first major overhead resistance at INR 55.50. The $'s rise against the INR from the low 51.35 has been fast and furious without a break, probably propelled by short covering by those caught short in the green buck. The $ needs to consolidate below 55.50 for a while before resuming the charge to the previous top.
We may see the $ fall back to retest 54 level and then move sideways between 54 and 55.50 for a couple of weeks to build a base for a further rally. In the long term there is nothing bullish about the INR on the charts.
 NASDAQ Composite: NASDAQ closed the week 2966.85, the point at which the daily bar for the index and its two most important exponential moving averages, the 50 DMA and the 200 DMA intersect. It is fairly rare technical confluence. But then the markets at this point are more technical in nature than responding to any fundamental pull except the pressure of Fed liquidity.
What we have just seen is a correction [yellow arrow] to the rise from the low of 2335 in October 2011 [red arrow] and with the break above both 200 and 50 DMAs that correction has ended.
We can expect a week or so of consolidation above the 200 DMA, just the gap at 2940 before the index resumes its uptrend to retest 3200.
 S&P 500: The SPX chart above is more ambiguous than that for the NASDAQ. However, both will resolve in the same direction. The SPX closed the week at 1409, well above its 200 DMA at 1375 and just at its 50 DMA.
The SPX's direction from here will be known only after the consolidation that follows Friday's move up 1409. Should SPX succeed in consolidating above its 200 DMA over the next week or so, we can expect the long-term trend up to reassert itself with a vengeance.
As noted in the case of NASDAQ, the balance of probabilities favors resumption of the uptrend and a retest of 1475 or even higher is then a real possibility.
 NIFTY: NIFTY's story is not that different from the US markets in the short term. NIFTY closed the week at 5626, well above the gap that persists below 5525. It was also above the trend line that runs along the base of the rally from the June 2012 low, barring the mini-crash.
Simply put, the NIFTY tried to correct down from the top of 5807 in October but couldn't make it past the top of the gap at 5525 in the first leg down.
The first leg down may have ended on November 19 and a corrective uptrend resumed which will be jagged and volatile in the normal course. Logically the target for the new uptrend is 5800. The nature and strength of the uptrend will tell us if we will have the much-awaited correction down to 4900 or not.
A new high above 5800 will almost surely call that scenario in question. But it is too early to tell.
Will take a look at Asian Markets mid-week again and revisit this question since most Asian Markets are hugging their lows while the US and EU markets are nearer their highs. That scenario is rather novel for the markets and India's NIFTY is somewhere between the two.
NB: These notes are just personal musings on the world market trends as a sort of reminder to me on what I thought of them at a particular point in time. They are not predictions and none should rely on them for any investment decisions.
Sonali Ranade is a trader in the international markets