Investors in India have a great buying opportunity in cyclical stocks that have completed their long corrections from the peak of 2007, says Sonali Ranade The last two weeks of trading in world markets have confirmed two trends. First, confirmation that the interest rate cycle has turned up. [The details are in the accompanying chart and commentary.] As the surge in yields gathers momentum, it will change all asset prices across the board and disrupt all lazy assumptions of asset price correlations. New models will have to be built anew. Second, the mighty dollar has confirmed [well very nearly so] that it too is in a bull run that could see it testing 90 over the next 12 to 15 months. These shifts are like the shifting of tectonic plates. They are small gradual, almost imperceptible shifts to begin with, but trigger unpredictable quakes that question every possible assumption. The big issue of course is gauging if the markets have peaked? This rally has been on an extended life for so long that one has to go back and think afresh about what might be driving it. Bull markets don’t end in a whimper, is an old tested saw. Frankly I expected an intermediate correction towards the end of February that would be shallow but extended in time without terminating the bull market. But the market thinks it has enough steam to power past May and could possibly extend well into mid-August! The rally in the mid-cap space shows equities are under-owned in the retail space and that is too much of an opportunity for the bulls to relent early. I see no profit in chasing stocks. I would still recommend taking the garbage out while sticking with blue chips. One could buy decent stuff like IBM or even MSFT as it breaks out of a long correction. Once markets go parabolic they also correct just as sharply and my strategy is always to buy doom and gloom and sell slowly into the euphoria. Investors in India have a great buying opportunity in cyclical stocks that have completed their long corrections from the peak of 2007. There are many blue chips among that universe of banks and old economy warhorses. I would buy them at bargain prices they are offering. For those who asked, there is my two-bit on strategy for trading Apple. |
|
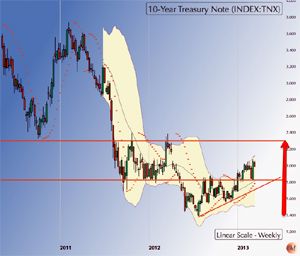 |
Yield on 10-Year USTs: Whatever the Wall Street rhetoric on “no evidence of great rotation” to “no major change in interest rates”, solid evidence above points to two incontrovertible facts. First, that yields on 10-year USTs bottomed out at 140 basis points in July 2012 and have consistently headed up since then. Second, the yields have now moved from the 140-to-180 trading range to the next higher range of 180-to-230 basis points. The moves have coincided with a stronger DXY in the FX markets. Ignore the evidence at your peril. The fact remains, that at some point, the surging yields are going to affect asset valuations across the board. |
|
US Dollar [DXY]: DXY closed the week at 82.256 after making a high of 83.18 during the week. The dollar’s orderly pullback to support after making a new high in this rally speaks of its inherent strength. In the ensuing week, we can expect the dollar to consolidate above 81.95 for a couple of days before resuming the trend higher. Maintain my view that the dollar is destined to a new high beyond 84.13 in the next two-three months. The positive correlation between rising yields & a resurgent Dollar should be noted. |
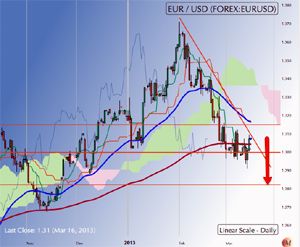 |
EURUSD: The euro closed the week at 1.3074 after making low of 1.2910, which happens to be a touch above is 200 DMA. The euro has been correcting down from its recent high 1.3712. A pullback before taking out the 200 DMA would be in the fitness of things in this correction. I see the euro consolidating just under 1.3220 for a few days before taking out the 200 DMA at 1.28 approx. However, I do not see the euro significantly lower than 1.27 in this leg of the correction never mind the usual “Europe is collapsing” din. |
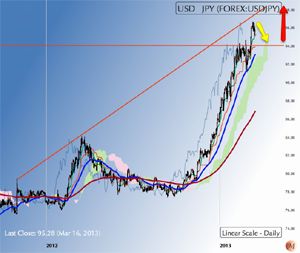 |
USDJPY: The dollar continues its strong surge against the yen, closing the week at 95.28 yen. There is no end to the rally in sight on the charts despite the near parabolic surge of the dollar. However, the dollar has clearly decided to test its old overhead resistance at 95 as its new support and this can solidify in the ensuing week before the dollar resumes its surge. |
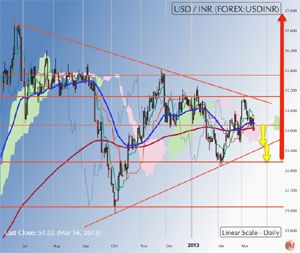 |
USDINR: The dollar continued to triangulate between the two vertices formed by its all-time high at 57.25 and the recent low 51.65. It closed the week at 54.02, a nick below its 50 DMA and well below its 200 DMA at 54.63. The dollar’s correction is correlated with its correction in the international markets from a high of 83 to 82. The $ fell in the rupee market despite the weakness in the equity markets. Be that as it may, the $ can correct down to 53.50 or even lower in the early part of next week but should resume its upward trend towards the previous top thereafter. Note, DXY is exactly at support. |
 |
Gold: Gold closed the week at $1590.70. The metal could move sideways in the 1620-1550 range for few more weeks before it tests its support at 1525. Despite the display of “strength” just above 1525, there is nothing bullish about gold. The “pullback” 1554 has been rather muted. My sense is that the longer gold hovers above 1525 the deeper will it will fall below 1525 eventually. Long-term bulls may note that Gold is signaling a very bearish wave count for the long term. |
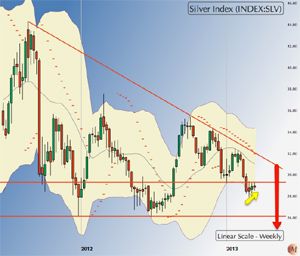 |
Silver: Silver closed the week at $28.85. Much like gold, silver’s pullback from its recent low of 27.92 has been very muted. To add to the woes of precious metal bulls, silver also signaled a death cross with its 50 DMA moving decisively below the 200 DMA. Silver could make a wild dash to its 200 DMA at $31 though the odds look slim. In my opinion, the metal is just building a base to take out the $28 support in the next three-four weeks. |
 0" /> |
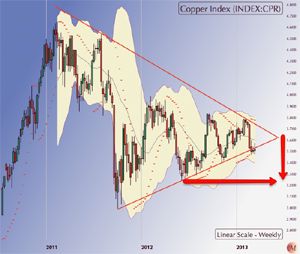
HG Copper: Copper closed the week at 3.52, just under its 200 Copper is in a downtrend from its recent top of 3.8 in what appears to the last leg of its correction from 4.6 in February 2011. The metal’s coyness just above 3.4 could be misleading. First support for the metal lies at 3.4 followed by another at 3.20. The metal could well test 2.9 by May or June. Note, copper correlates positively with Shanghai equity indices. |
 |
WTI crude: Crude closed the week at $93.45 after bouncing off its 200 DMA at $89.46. And it closed just under its 50 DMA, which is currently at 94. That would be impressive except that it came with correction in the DXY. Crude has an overhead resistance at $95 followed by another at $98. Crude could well rally to these levels. However, a failure to take out $98 decisively will confirm that crude remains in a long-term down trend with a target of $84 for this correction. Note, crude could turn down from $95 itself. Don’t trade oil against the trend -- if you can find any! |
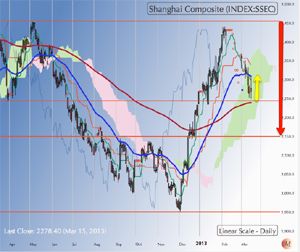 |
Shanghai Comp: Shanghai Comp closed the week at 2278.40 bouncing off its 200 DMA 2236 but failing to clear its 50 DMA. The index is correcting for its rally from 1950 to 2446 and the correction is by no means over. The Chinese tend to test market extremes multiple times and this correction could well go all the way to 1950. As noted in the earlier articles, there is room in the charts for a new low in the vicinity of 1950 both in terms of time and wave counts. Expect the 200 DMA to be taken out sometime over the next two weeks. |
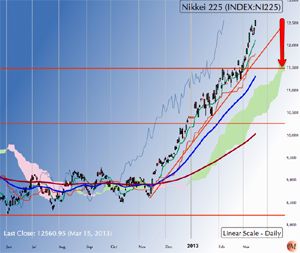 |
NIKKEI 225: NIKKEI closed the week 12,381. Predicting corrections in surging markets like the one in Japan, driven by government policy is hazardous business. Nevertheless one must note what the markets are saying. In terms of wave counts, the index is due for a correction, and could well test 11500 as the new support any time over the next two weeks. However, that correction is not likely to last long in time even if it is very sharp in price. Upon testing and holding 11,500, NIKKEI is likely to surge much higher -- perhaps 14,000! |
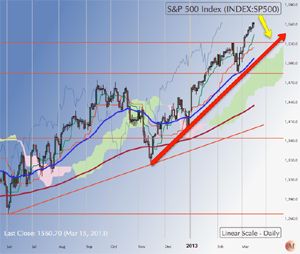 |
S&P 500 [SPX]: SPX closed the week at 1560.7 and is only 16 points away from its all-time high of 1576. Note, DJIA and RUT have already made new all-time highs so expecting the SPX to follow suit is not unreasonable. That said, 1576 is a crucial overhead resistance and a correction before that would be in order. My sense is that we would see a correction in SPX in the early part of next week that could test its support 1531 although it needn’t go that far. Upon testing and holding 1531 in the ensuing correction, expect SPX to take out its previous top. Else the rally more or less terminates here. |
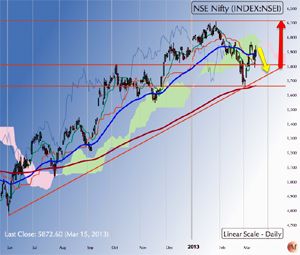 |
NSE NIFTY: NIFTY closed the week at 5872.60 turning down from just under its 50 DMA 5940. My sense is that NIFTY is in a minor correction for the rally from 5660 to 5970 that could see it testing 5750 or even 5670 again. Upon testing and holding above 5670, we are likely to see the NIFTY rally towards its previous highs in line with world markets. For the first time, charts indicate that NIFTY is in sync with world markets after all. Investors should use the buying opportunity for picking up blue chips that have recently completed their corrections from the 2007 peaks. |
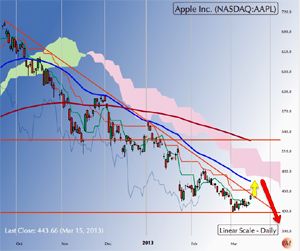 |
Apple & NASDAQ: Following my contrarian tweets in $AAPL a lot of people have asked for a technical view on Apple. As rule I don’t discuss stocks. But my reason for not accepting that the rally in NASDAQ has ended has been based on the logic that bull markets don’t peak with frontline blue chips at correction lows. NASDAQ was and is replete with stocks like INTC, MSFT, IBM, AAPL etc, which have been correcting since April 2012. |
| Blue chips don’t begin to correct 11 months before a rally peaks. Therefore my caution that NASDAQ could pull rabbits out of its hat. Subsequent events have proved my hunch right. IBM, MSFT et al have broken out from lows or are on the verge of doing so and such rallies could well create new highs in these stocks. My contrarian play in AAPL was based on such a logic but not entirely so. I was one of the first to call top in $AAPL at 700 when I tweeted about accumulating inventories at Malls with no customers in them new stores! Those accumulated inventories will take time and discounts to clear. I would have to show my Apple charts stretching from April 2003 [when Apple used to quote $7 per share!] to demonstrate the textbook “bullish correction” that is now underway. Of course such bullish corrections can be very deep & sharp. Apple’s history shows that when it corrects, it does so furiously. On that reckoning Apple could well be $200 by 2014 before this correction is over. Though my target for the ultimate end of this correction over the next 15 months is a more modest $300. That said, sideways movements in stocks make for great trading plays for traders and that’s what Apple is for the next 15 months as it meanders thru is correction from 700 to 300. Striking 50 per cent [nearly] from the top, isn’t it? So where does Apple go from here? My sense it goes to $360 before it builds up a base for a bear rally to something close to $500. Can one catch this rally in a manner that makes a decent profit? My sense is that you can’t unless you get exceedingly lucky. My tactic is therefore to buy solid identifiable supports, at specific wave counts, and get out for small profits till you have confirmation that a low has been made. From a low of $420, the stock can rally to about 460 before it turns down again for significant new low. I would then look to buy some around $360. Would I short at $460? Nope. I have got better things to do with my limited capital. Happy trading! NB: These notes are just personal musings on the world market trends as a sort of reminder to me on what I thought of them at a particular point in time. They are not predictions and none should rely on them for any investment decisions. Sonali Ranade is a trader in the international markets |
|


 © 2025