It is too early to say if we have seen the "final" bottom to these stocks in August 2013 or if another attempt to test them will be made before or just after elections, says Sonali Ranade.
The US, Europe and Japanese markets ended 2013 at or near all-time highs and have been working off the excesses in the first two weeks of the new year. All indications are that with the end of the current consolidation over the next, the uptrend may resume shortly. Barring Shanghai, there is nothing bearish about most equity markets.
Back home, the broader universe of Indian stocks made new lows or significant lows after the crash to lows in March 2009. In some cases the rallies from these lows have been fairly sharp. It is too early to say if we have seen the "final" bottom to these stocks in August 2013 or if another attempt to test them will be made before or just after elections. For the nonce, the rally from August lows continues and some wave counts that favour suggest that this may extend to Mid-March. Investors should hold with an appropriate stop-loss. It is unlikely that Indian markets will step out of sync with global markets until elections loom.
Early bears fuel parabolic terminal bull-runs! Beware.
 S&P 500
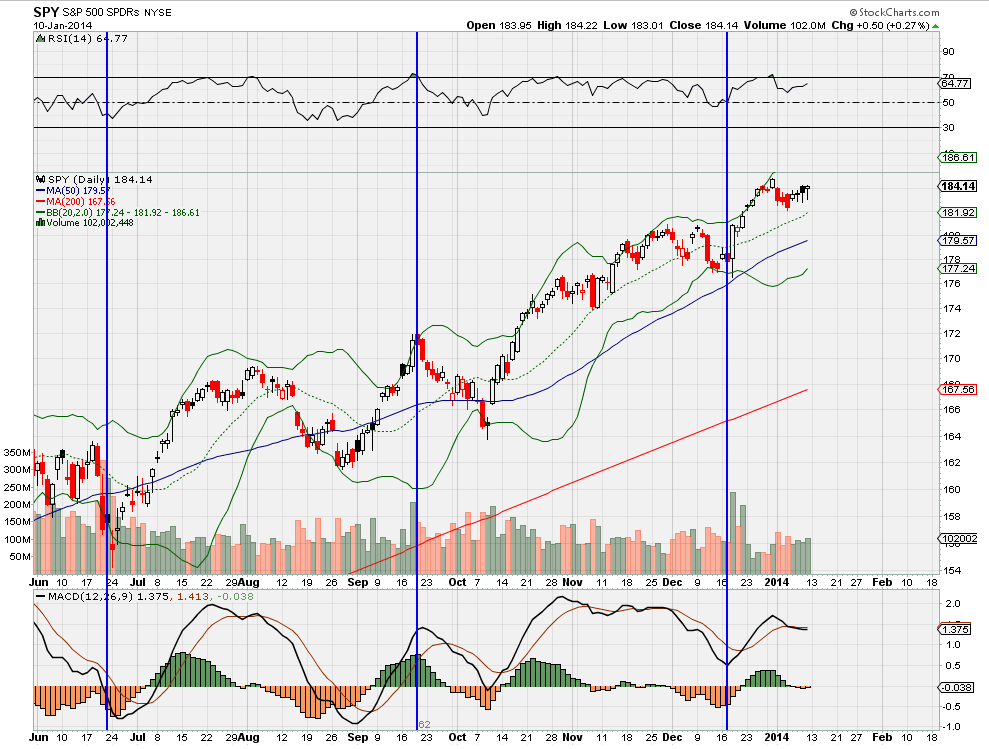
The SPY chart, the traded ETF of S&P 500, is shown here. S&P 500 closed Friday at 1842.37 and appears to be on its way up to retest the previous top at 1850. Incidentally, 1850 happens to be on a very important trend line running up from the low of March 2009, through the top in March 2012, to the top on December 31. The trend-line used to be a very important support line from March 2009 to August 2011, and has been a formidable resistance since then. Taking out the resistance would be a very rare but important technical event.
The Index's 50 DMA lies at 1799, while its 200 DMA lies way below at 1689. The S&P 500 usually doesn't stray that far above its 500 DMA. The fact that 1850 lies on a very formidable resistance, from where the Index reacted and the current "stretch" away from the 200 DMA suggests further consolidation. First support lies at 1808, which is pretty close to the 50 DMA, followed by more support at 1765. S&P 500 has usually turned up from the vicinity of it 50 DMA in recent corrections. We are therefore unlikely to see a breach of 1800 in the event of further consolidation.
There is nothing bearish on the charts for the medium term. Barring a drop to 1800 next week, the market should continue to trend up till the middle of May 2014. Dips to 1800 would be a buying opportunity for traders.
 NASDAQ 100:
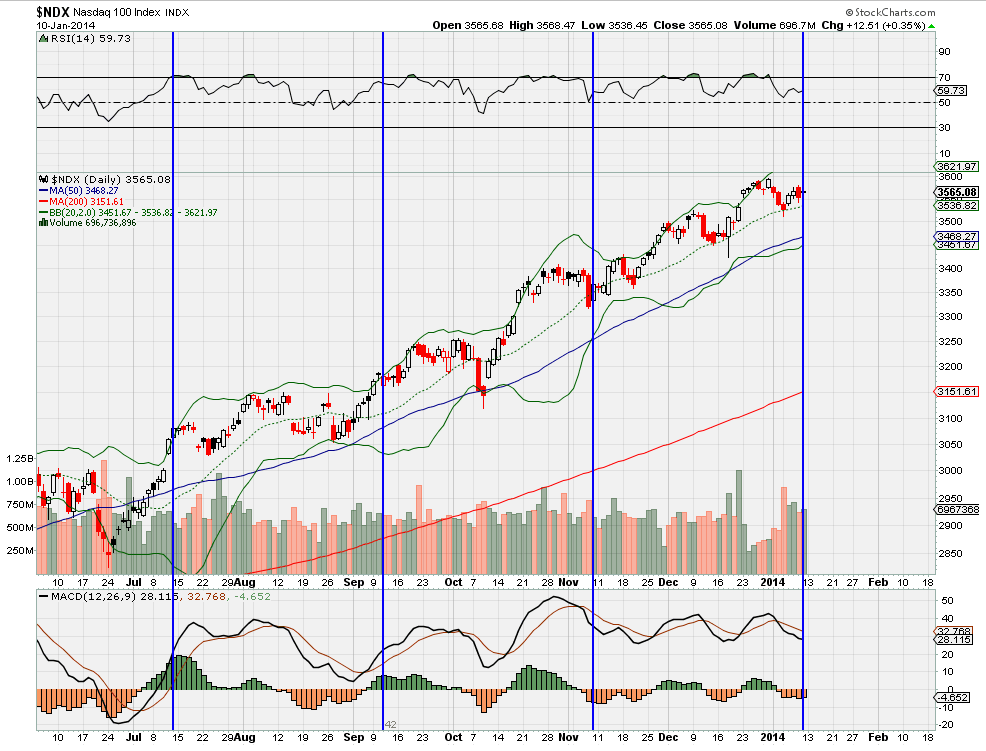
There is nothing bearish about the NASDAQ 100 [$NDX] in the chart shown here. $NDX closed Friday at 3536.08. First support for the Index lies at 3518 followed by more support at its 50 DMA now at 3468. Its 200 DMA is way below at 3151. The Index's Price ROC oscillator is close to support. Barring a minor consolidation early next week in sympathy with $SPY, the index is headed up. Sharp rallies to the upside are more likely until Mid-May than sharp reactions. It is unwise to play bear in the Index.
 DAX
DAX
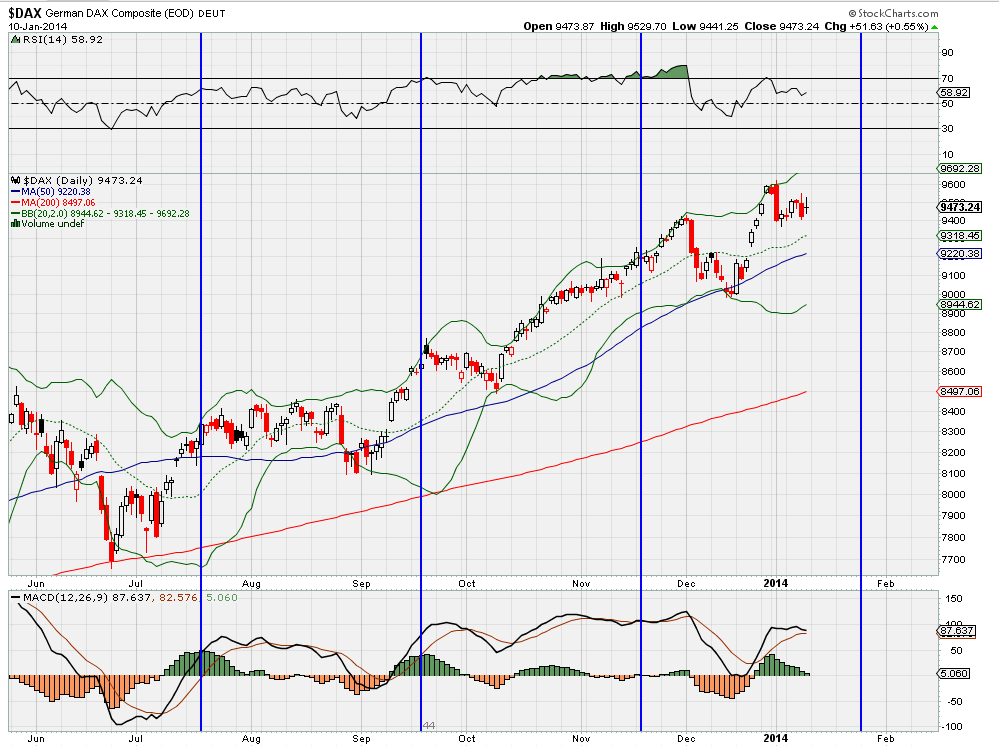
$DAX like the US Indices is into a major bull move that could last until Mid-May well above 10,000. That said, in the near term, the Index entered into a short-term correction on December 30 from a top of 9594 that may see the Index testing its 50 DMA, which currently lies at 9220. The consolidation itself could take the first few days of next week.
$DAX has a habit of testing its 50 DMA twice before major moves to the upside. The Index's 14 day RSI is at 59 and heading towards 40. That more or less suggests one more attempt to test the 50 DMA before the rally to Mid-May. Beware if the rally to mid-May goes parabolic.
 Shanghai Composite
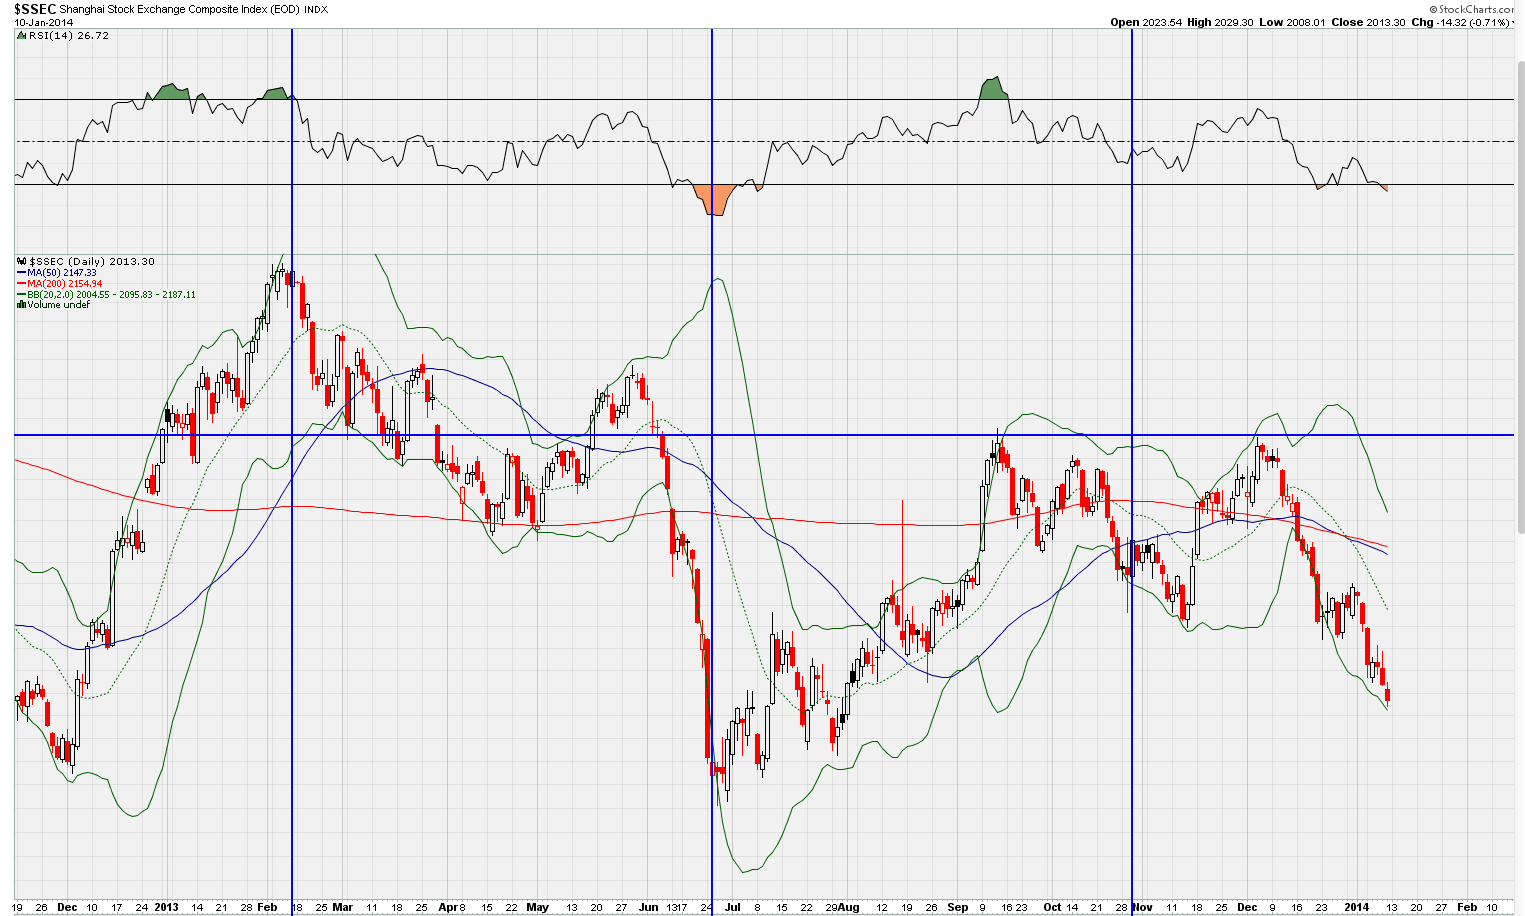
Clearly, the Shanghai Composite is marching to a dynamic of its own ignoring other world markets.
The Index closed at 2013.3 last Friday, well below its 50 & 200 DMAs, which are both in the 2125 region with the 50 DMA having generated a sell signal. The Index's previous bottom lies at 1850 and there is no reason why the Index should stop short of the mark in the current downtrend.
The wave counts from the last major top in February 2013 suggest the Index may well seek levels lower than 1850. The next support below 1850 lies at the October 28 low of 1771.82. That could well be tested.
 NSE CNX 500
The CNX NIFTY, although widely traded, has become rather unrepresentative of the broader Indian market. The NIFTY is touching all-time highs while 70 pc of the stocks listed on the NSE are barely 30 to 50 pc above their March 2009 lows. Therefore, to give a better sense of the market, I track the CNX 500 and the NSE Mid-Cap Index that are more representative of the larger universe of Indian stocks.
The NSE CNX500 is an intermediate uptrend from the low of 3535 made on December 20, 2011, and that trend continues. The Index made a top of 4877.65 on May 20, 2013, before going into a correction that saw a low of 4054 on August 27, 2013. The corrective wave ended November 3, 2013, at 4847 and we are now seeing an effort by the Index to test the previous support for the Index at 4650. There are multiple supports before the Index hits 4650 and it could well halt much before that level.
My sense is that this consolidation of the CNX500 may continue for a few more trading days into the next week before the uptrend resumes. Investors should keep a stop-loss at 4600 and hold unless breached. With the US markets likely to turn up shortly, I am not bearish on the broader Indian market as yet, largely because the larger universe of stocks are at ridiculously low valuations.
NSE MID-CAP INDEX
A noteworthy feature of the larger universe of NSE stocks is that a large number of them made new lows or significant lows in August 2013, after the crash of January 2008. In relation to these micro and midcaps, the question is if we will see another attempt to test the lows of August 2013 or is a bottom in place?
The second question nagging minds is the general election due in May 2014 and what impact that may have on the Indian markets.
The wave counts for NSE 500 and the MidCap Index are analogous. The MidCap Index made a low of 6030 on December 20, 2011, and has been in an intermediate uptrend from there. It subsequently made a top of 8768 on January 8, 2013, and corrected to a low of 6515 on August 27, 2013. My sense is that unless 7600 on the Index is breached, we may see the current rally from August continuing [with periodic corrections] up until mid-March 2014.
However, not all stocks may be strong enough to attempt a rally right up to mid-March. There will be those that started their correction on December 31, 2013, itself. Given the rallies in US, Europe and Japan, I would continue to hold stocks until stopped out by a breach of 7600.
NB: These notes are just personal musings on the world market trends as a sort of reminder to me on what I thought of them at a particular point in time. They are not predictions and no one should rely on them for any investment decisions.
Sonali Ranade is a trader in the international markets.