 Today, the biggest concern facing the country is rising prices. There is uproar in Parliament as political parties jostle to grab as much mileage as possible from the government's apparent failure to curb runaway inflation, as they try to sidle up to the aam aadmi who has been worst hit by skyrocketting prices.
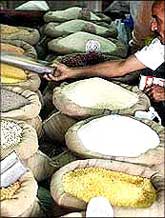
Food inflation is hovering near 20 per cent. Everyone is facing the brunt of rising prices. Food prices are soaring. . . all essential items like vegetables, oil, milk, sugar are getting costlier. Rentals and real estate rates have almost doubled in just a few months in most cities. The real estate prices are at record highs making life miserable, especially for people who have migrated to cities for jobs.
Inflation hits you badly as prices keep rising. You end up spending more money for things that you could buy for les earlier. What you could buy for Rs 100, some months ago, would now cost you nearly double. As a result, your savings will come down. As prices rise, the purchasing power of money goes down too.
Inflation hits retired folk and people with fixed incomes very badly. Inflation destablises the economy as consumers and investors change their spending habits.
Economists attribute inflation to a demand-pull theory. According to this, if there is a huge demand for products in all sectors, it results in a shortage of goods. Thus prices of commodities shoot up.
Another reason for inflation is the cost-push theory. It says that labour groups also trigger inflation. When wages for labourers are increased, producers raise the prices of products to make up for salary hike.
The rising prices of food products, manufacturing products, and essential commodities have pushed inflation rate further in India.
This is how food prices have risen since 2007:
- Food articles: 7.02% (in 2007) to 17.41% in January 2010.
- Food products: 3.43% (in 2007) to 22.55% in January 2010.
- Food commodities: 5.60% (in 2007) to 19.42% in January 2010.
- Foodgrains: 6.27% (in 2007) to 17.89% in January 2010.
- Cereals: 6.27% (in 2007) to 13.69% in January 2010.
- Pulses: 2.14% (in 2007) to 45.62% in 2007 in January 2010.
- Rice: 6.05% (in 2007) to 12.02% in January 2010.
- Wheat: 6.77% (in 2007) to 14.86% in January 2010.
- Dairy products: 6.08% (in 2007) to 12.87% in January 2010.
- Eggs, fish and meat: 6.38% (in 2007) to 30.71% in January 2010.
- Sugar: (-)14.69% (in 2007) to 58.94% in January 2010.
Inflation in Food and Non-food Commodities during 1994-95 to January 2010
(Based on WPI with base 1993-94) and Growth Rate in Food Output (%)
|
Item |
1994-95 to 2004-05 |
2005 |
2006 |
2007 |
2008 |
2009 |
2010 January |
Average 2006-09 |
|
1. All commodities |
5.90 |
4.74 |
4.82 |
4.82 |
9.12 |
2.01 |
8.54 |
5.19 |
|
2. Non-food commodities |
6.02 |
5.37 |
4.72 |
4.54 |
9.55 |
-1.76 |
4.53 |
4.27 |
|
3. Food articles |
5.91 |
3.94 |
6.83 |
7.02 |
6.64 |
12.32 |
17.41 |
8.20 |
|
4. Food products |
5.33 |
1.58 |
2.55 |
3.43 |
9.80 |
13.79 |
22.55 |
7.39 |
|
5. Food commodities (3 and 4) |
5.64 |
2.97 |
5.09 |
5.60 |
7.87 |
12.90 |
19.42 |
7.86 |
|
Foodgrains |
5.54 |
3.83 |
9.71 |
6.27 |
6.37 |
14.14 |
17.89 |
9.12 |
|
Cereals |
5.57 |
3.68 |
6.63 |
6.97 |
7.20 |
12.96 |
13.69 |
8.44 |
|
Pulses |
5.46 |
5.04 |
32.05 |
2.14 |
1.30 |
21.81 |
45.62 |
14.33 |
|
Rice |
5.00 |
4.01 |
2.13 |
6.05 |
8.97 |
15.96 |
12.02 |
8.28 |
|
Wheat |
5.93 |
1.08 |
12.99 |
6.77 |
5.06 |
6.83 |
14.86 |
7.91 |
|
Oilseeds |
5.89 |
-6.11 |
-3.96 |
26.58 |
17.46 |
0.92 |
10.05 |
10.25 |
|
Fruits and vegetables |
7.47 |
7.51 |
2.24 |
6.49 |
5.94 |
11.77 |
8.33 |
6.61 |
|
Dairy products |
5.20 |
0.11 |
4.20 |
6.08 |
8.38 |
6.12 |
12.87 |
6.19 |
|
Milk group |
5.57 |
0.73 |
4.48 |
8.17 |
7.87 |
8.93 |
13.99 |
7.36 |
|
Egg, fish and meat |
6.46 |
9.46 |
6.72 |
6.38 |
3.75 |
14.44 |
30.71 |
7.82 |
|
Edible oils |
4.85 |
-7.19 |
1.23 |
13.11 |
12.52 |
-6.59 |
-1.17 |
5.07 |
|
Sugar |
4.06 |
15.09 |
4.83 |
-14.69 |
5.62 |
36.34 |
58.94 |
8.02 |
|
Growth in food output (%/a year) |
2.39 |
0.55 |
5.87 |
4.10 |
5.39 |
1.60 |
-02 AE |
4.24 |
(1) AE stands for Advance Estimate provided by CSO. (2) Growth rates in last row refer to financial year ending with, like 2005 stands for 2004-05.
Sources: (1) Office of Economic Adviser, Ministry of Commerce and Industry, GOI, New Delhi. (2) National Accounts Statistics, CSO. (3) Department of Agriculture and Cooperation, Ministry of Agriculture, GOI, New Delhi.
Source: Ramesh Chand, "Understanding the Nature and Causes of Food Inflation", EPW, February 27, 2010
Spiralling global crude oil prices have worsened the situation. Sometimes, banks create more liquidity by allowing more loans for people, giving them the purchasing power to buy more, as a result of which prices are driven up further. The demand-supply gap also drives inflation rates.
Finance Minister Pranab Mukherjee, after he presented the Budget on February 26, said that "taking into account all the increases, inflation will be around 0.4 per cent in WPI (wholesale price index). We have announced a number of measures (to control inflation). For instance, you have to step up domestic supply, but it will take some time. So, you have to bridge the gap by imports. Whatever steps were needed we have taken. We have given duty concessions. We have allowed duty-free imports by putting items under OGL (open general licence).'
"To ameliorate the sufferings of the vulnerable sections, at least the persons below the poverty line, we have provided subsidised articles like edible oil with a subsidy of Rs 15 per litre. We are requesting the states to distribute it. In the next couple of months, it will have a moderating influence," the finance minister said.
But when will these measures help in bringing down inflation and food prices? Your guess is as good as ours.