| « Back to article | Print this article |
In graphics: State of the economy
Last updated on: July 2, 2009
In graphics: State of the economy
Last updated on: July 2, 2009
In graphics: State of the economy
Last updated on: July 2, 2009
In graphics: State of the economy
Last updated on: July 2, 2009
In graphics: State of the economy
Last updated on: July 2, 2009
In graphics: State of the economy
Last updated on: July 2, 2009
In graphics: State of the economy
Last updated on: July 2, 2009
In graphics: State of the economy
Last updated on: July 2, 2009
In graphics: State of the economy
Last updated on: July 2, 2009
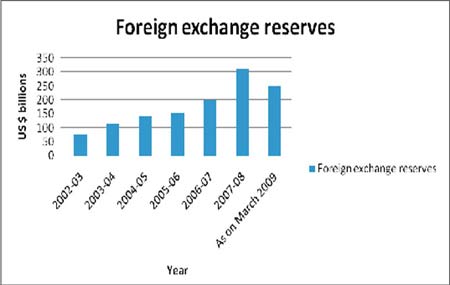
Forex reserves.
In graphics: State of the economy
Last updated on: July 2, 2009
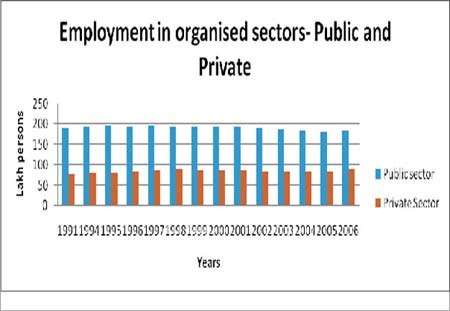
Employment in organised sectors, public and private.
In graphics: State of the economy
Last updated on: July 2, 2009
In graphics: State of the economy
Last updated on: July 2, 2009
In graphics: State of the economy
Last updated on: July 2, 2009
In graphics: State of the economy
Last updated on: July 2, 2009

In graphics: State of the economy
Last updated on: July 2, 2009
In graphics: State of the economy
Last updated on: July 2, 2009