

Mukul Pal in New Delhi
On one side, we have computer algorithms, blamed for the Dow 1,000-point move, all the panic in volatility, the 10-dollar move on oil, etc.
On the other side, we have the hands-on Elliott approach, which does not need number-crunching computers. Orpheus has been covering oil since early 2005.
In May 2008 (oil made a high of $133) we wrote 'The Oil Rocket'. We said: "Nothing can rise exponentially, even if it's oil.
...
Oil's last dip before rising to $300
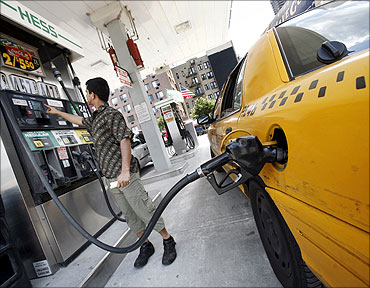
Photographs: Shannon Stapleton/Reuters.
The asset's exponential rise is more an indication of an ending trend and not vice versa. The oil rocket can never become a satellite, no asset can. And, the almost 90-degree inclination to new highs is destined to collapse.
Few Wall Street brokers looked at this as a great time to solicit mass mailing lists for oil call options.
Well, we don't subscribe to the oil-end era yet, but if the best broker suggests buying calls with such confidence, we definitely don't know something he knows or something everybody knows. At this stage, what we can see is a sentiment euphoria which is hard to sustain.
...
Oil's last dip before rising to $300
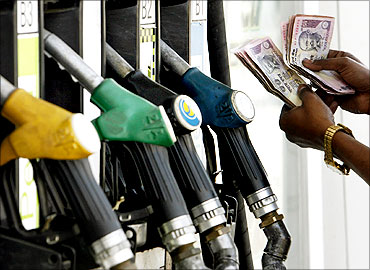
Photographs: Rupak De Chowdhuri/Reuters.
The five-legged fractal structure, both starting 1999 till 2008 and the smaller five-legged, sub-structure starting in 2007 seems complete. We don't see oil above $125 and it's time for a put, not a call.
Oil should push to sub-$70 levels." While we talked of oil declining to $70 while at all-time highs, we also mentioned that after the fall, the move up to $300 should begin. Oil fell to sub-$40 in December 2008.
After prices crossed the psychological 50, the intermediate reversal was in.
...
Oil's last dip before rising to $300
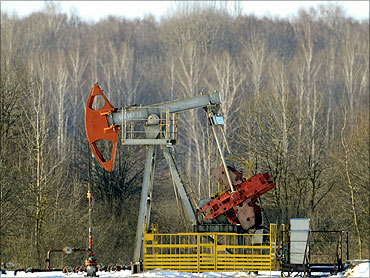
Photographs: Vasily Fedosenko/Reuters.
Oil moved up till June 2009. In August 2009, oil was in completing a flat and after a dip, pushed up to new highs. Starting November 23, 2009, prices started making a termination pattern.
The ending diagonal suggested a final upmove into $80-90 prices before turning lower. Ending diagonals are known to retrace completely and are major reversal formations. The pattern suggests oil could retrace to $60.
...
Oil's last dip before rising to $300
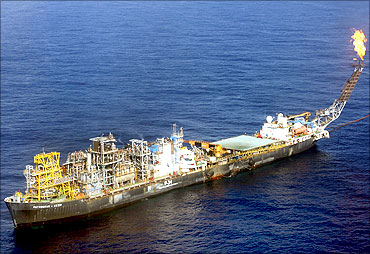
Photographs: Jamil Bittar/Reuters.
The times ahead should be similar to what we saw from the mid-1970s to the early 1980s, when gold made a historical high. This time, gold and oil are ready for a higher high. The ongoing dip on oil should be our last and best opportunity to buy it for a move up till 2015.
Oil at $300 remains our preferred view. What does this mean for economics? For society? You don't need an algorithm to understand what this means for inflation.

article