
The global economy has been on a recovery phase since the second half of 2009, after hitting a bottom in the first half 2009.
While it is important to keep an eye on the key financial news that comes out each month, it is even more important for investors to have a clear understanding about the overall corporate earnings trend.
While the US economy has been going through a difficult recovery following the worst financial crisis since the Great Depression, its companies are making money.
In fact, earnings per share levels for US companies in the S&P 500 Index are expected to hit their highest ever levels by 2011-2012.
A study by Fundsupermart.com says Sensex is expected to hit 23,634 points by end-2012.
Researchers at Fundsupermart.com believes that there is a possibility that actual earnings may turn out to be even higher than consensus estimates, given the fact that earnings estimates from various brokerage houses remain fairly cautious following the global financial crisis.
So how will these 15 stock markets perform? Click on NEXT to find out...

For FY 2011, the following sectors are expected to have higher EPS growth than the Sensex's EPS growth of 16.8%:
For FY 2012, the following sectors have higher growth in EPS than the Sensex's 20.1%:
For FY 2013, the following sectors have higher growth in EPS than the Sensex's 16.7%:
Infrastructure and banking sectors will play a crucial role in EPS growth going forward as more than $1 trillion is expected to be invested into the infrastructure sector in FY 2013-17, compared to planned investments of $542 billion. in FY 2007-12.
| Fiscal Year | 2011 | 2012 | 2013 |
| Earnings per Share (EPS) | 997.27 | 1198.18 | 1398.50 |
| Earnings Growth | 16.8% | 20.2% | 16.7% |
| Source: Bloomberg, iFAST compilations (as of end-August 2010) | |||
Click on NEXT to read more...

Financials sector is expected to post fastest profit growth in 2011 (+27.7%).
Materials, industrials and energy are expected to see profits rise 26.7%, 17.1% and 16.8% in 2011 respectively.
Weakest 2011 growth to come from utilities and healthcare (+2.4% and +7.8%).
| Fiscal Year | 2010 | 2011 | 2012 |
| Earnings per Share (EPS) | 82.93 | 97.30 | 110.60 |
| Earnings Growth | 35.4% | 17.3% | 13.7% |
| Source: Bloomberg, iFAST compilations (as of end-Aug '10) | |||
Click on NEXT to read more...

Europe Stoxx 600
Based on EPS growth, the three fastest growing sectors for 2011 are:
The three slowest growing sectors for 2011 are:
The three fastest growing sectors for 2012 are:
The three slowest growing sectors for 2012 are:
Financial sector is the index heavyweight and the key driver of earnings.
| Fiscal Year | 2010 | 2011 | 2012 |
| Earnings per Share (EPS) | 22.29 | 25.91 | 29.01 |
| Earnings Growth | 32.1% | 16.3% | 11.9% |
| Source: Bloomberg, iFAST compilations (as of end-Aug '10) | |||
Click on NEXT to read more...

Japan Nikkei 225
Due to the low earnings in FY 2010, we expect earnings growth in FY 2011 to rise strongly.
According to Ministry of Finance, corporate profits rose 83.4% y-o-y and 18% m-o-m in the first quarter of FY 2011 FY (April to June).
Strong earnings growth in various sectors has been seen in Japan, especially for the manufacturers which have benefitted from the global economic recovery.
Confidence of Japan's large manufacturers rebounded for a fifth straight quarter, thanks to robust demand from Asia.
Large companies forecast rising sales will drive profits 21.6% higher in this fiscal year.
The business confidence indices for all the categories of companies improved in the quarter, the first time since 1994.
Earnings at Japan's banking sector are finally back to pre-crisis levels.
Japan's three mega-banks all reported net profits of over yen 100 billion for the April-June 2010 quarter.
| Fiscal Year | 2011 | 2012 | 2013 |
| Earnings per Share (EPS) | 576.54 | 639.42 | 786.23 |
| Earnings Growth | 64.7% | 10.9% | 23.0% |
| Source: Bloomberg, iFAST compilations (as of end-Aug '10) | |||
Click on NEXT to read more...

Singapore STI
Largest profit growth will come from leisure and commodities sectors (2007-2012).
Banks are expected to post a higher profit in 2012 than in 2007.
Media, shipping and property are expected to post sluggish growth/profit declines in 2012, compared to 2007.
Telecommunications sector is expected to show low single-digit growth over 5 years.
Offshore/rig-builders are still expected to post higher profit in 2012 compared to 2007, but 2010 should be their peak profit year.
| Fiscal Year | 2010 | 2011 | 2012 |
| Earnings per Share (EPS) | 206.99 | 225.47 | 247.49 |
| Earnings Growth | 21.8% | 8.9% | 9.8% |
| Source: Bloomberg, iFAST compilations (as of end-Aug '10) | |||
Click on NEXT to read more...
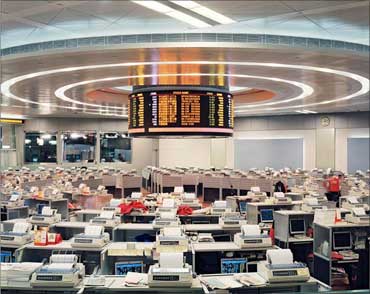
Hong Kong (HSI)
Hong Kong's GDP expended 6.5% year-on-year in the second quarter of 2010. The government forecasts GDP growth to hit 5% to 6% for the full year.
In 2010, the largest earnings growth is expected to come from the Info tech sector, followed by the Industrials sector.
As more rapidly-growing HK-listed Chinese stocks become Hang Seng Index‟s constituents, HSI's consensus earnings may be further revised upward.
Retail sales in HK have been posting a double-digit growth while the improving labour market and a growing number of mainland tourists will likely boost domestic demand. The consensus earnings suggest the consumer sector in HK will grow even faster in 2011 and 2012.
As many Hong Kong companies expand their mainland China operations, they could also ride on China's strong growth.
For instance, HK property developers have been aggressively increasing their land bank in Chinese cities.
Similarly, HK financials are seeking new opportunities in mainland China as the industry in Hong Kong is rather mature.
| Fiscal Year | 2010 | 2011 | 2012 |
| Earnings per Share (EPS) | 1540.16 | 1783.32 | 2032.98 |
| Earnings Growth | 12.2% | 15.8% | 14.0% |
| Source: Bloomberg, iFAST compilations (as of end-Aug '10) | |||
Click on NEXT to read more...
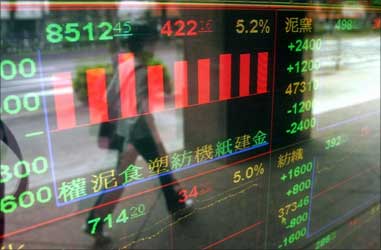
Taiwan (TWSE)
Taiwan's economy grew faster than China's in H1 2010 and posted double-digit growth, with revised Q1 2010 GDP up 13.71% y-o-y and Q1 2010 GDP up 12.53% y-o-y.
Led by the industrials, financial and the infotech sectors, the TWSE's earnings are expected to double in 2010.
This growth is expected to be the highest in the Asia ex- Japan region.
Technology companies' capex spending has been gaining huge momentum this year.
Non-tech sectors have seen huge earnings upgrades, led by tourism and some manufacturing sectors.
| Fiscal Year | 2010 | 2011 | 2012 |
| Earnings per Share (EPS) | 595.15 | 669.51 | 725.37 |
| Earnings Growth | 110.8% | 12.5% | 8.3% |
| Source: Bloomberg, iFAST compilations (as of end-Aug '10) | |||
Click on NEXT to read more...
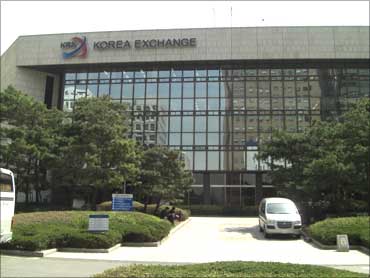
South Korea (KOSPI)
Within the KOSPI, the auto, semiconductors and IT sectors are expected to lead EPS growth in 2010.
Earnings growth in 2010 for semiconductors and IT sectors are estimated to rise by 50.6% and 30.5% respectively.
Auto sector is also expected to post 47% growth in 2010 earnings. As a result, the 2010 estimated earnings growth of KOSPI is 56.2%.
Despite concerns over the European debt crisis and the possibility of a double-dip recession, earnings in these sectors have still been revised upward.
Korea's technology exports to the BRIC countries have exceeded those to the G3 markets since September 2009 (by value).
These figures explain why the earnings of Korean exporters have been upgraded sharply in recent months as global trade picked up with demand from the emerging markets.
| Fiscal Year | 2010 | 2011 | 2012 |
| Earnings per Share (EPS) | 182.07 | 192.86 | 215.23 |
| Earnings Growth | 56.2% | 8.3% | 8.9% |
| Source: Bloomberg, iFAST compilations (as of end-Aug '10) | |||
Click on NEXT to read more...
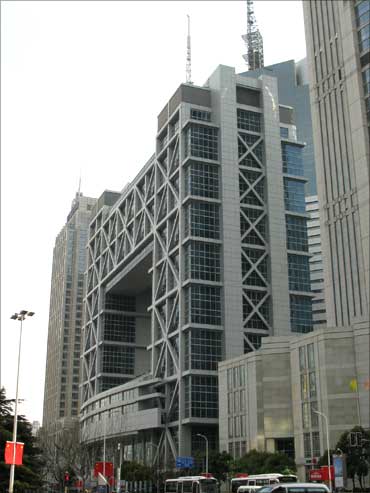
China (SHASHR)
China's economy expanded by 11.9% y-o-y and 10.3% y-o-y in 1Q10 and 2Q10 respectively.
Despite concerns of an economic slowdown, the economy is expected to grow by 10% in 2010 and the chance of a 'hard landing' is very low.
Despite slower growth, China's role in contributing to the global economic growth remains important amid the longer-than-expected sub-par growth in the developed markets.
In 2010, the largest earnings growth is expected to come from the infotech sector, followed by the materials and the industrial sectors.
Consumption will likely become the growth driver for the economy in the 12th Five Year Plan, compared to infrastructure in the previous plan.
With a population of 1.3 billion, China indeed hasn't unleashed its potential to be the world's largest consumer.
| Fiscal Year | 2010 | 2011 | 2012 |
| Earnings per Share (EPS) | 177.77 | 213.01 | 246.88 |
| Earnings Growth | 36.8% | 19.8% | 15.9% |
| Source: Bloomberg, iFAST compilations (as of end-Aug '10) | |||
Click on NEXT to read more...
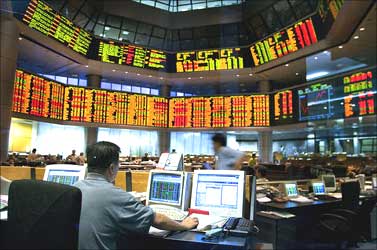
Malaysia (KLCI)
The proposed Government Transformation Programme (GTP) and New Economic Model (NEM) aim to increase household disposable income, enhance infrastructure and reduce crime and corruption.
A successful implementation of the GTP and NEM could increase the standard of living and hence domestic demand.
Furthermore, it will attract more foreign fund flows into Malaysia.
The Bank Negara Malaysia is going to liberalise the financial and banking system.
Economic growth in Malaysia remains healthy, backed by improved domestic consumption and exports, especially exports of electrical and electronic products.
The Malaysia Institute of Economic Research revised the GDP growth rate for 2010 to 6.5% y-o-y from the previous forecasted growth rate of 5.2%. GDP for Q1 and Q2 2010 grew 10.1% and 8.9% y-o-y.
Banking sector remains the main driver of growth in KLCI's EPS.
| Fiscal Year | 2010 | 2011 | 2012 |
| Earnings per Share (EPS) | 91.47 | 102.72 | 111.88 |
| Earnings Growth | 25.5% | 12.3% | 8.9% |
| Source: Bloomberg, iFAST compilations (as of end-Aug '10) | |||
Click on NEXT to read more...

Thailand (SET)
Based on EPS growth, the three fastest growing sectors for 2011 are:
The three slowest growing sectors for 2011 are:
Three fastest growing sectors for 2012 are:
Three slowest growing sectors for 2012 are:
Energy and financials sectors are the index heavyweights and will be the key drivers of earnings.
| Fiscal Year | 2010 | 2011 | 2012 |
| Earnings per Share (EPS) | 69.60 | 81.16 | 92.52 |
| Earnings Growth | 8.5% | 16.6% | 14.2% |
| Source: Bloomberg, iFAST compilations (as of end-Aug '10) | |||
Click on NEXT to read more...

Indonesia (JCI)
Based on EPS growth, the three fastest growing sectors for 2011 are:
Energy is expected to see strong growth relative to the low base in 2009 as earnings were battered that year.
The three slowest growing sectors for 2011 are:
The three fastest growing sectors for 2012 are:
The three slowest growing sectors for 2012 are:
Financial sector is an index heavyweight and will be a key driver of earnings.
| Fiscal Year | 2010 | 2011 | 2012 |
| Earnings per Share (EPS) | 205.64 | 246.90 | 287.43 |
| Earnings Growth | 28.06% | 20.0% | 16.4% |
| Source: Bloomberg, iFAST compilations (as of end-Aug '10) | |||
Click on NEXT to read more...

Russia (RTSI)
The study thinks Russia's worst drought in decades has a limited impact on its economy as the agricultural sector only accounts for a small GDP share.
Led by the financial and the material sectors, Russia's earnings re-rating process has lagged behind other equity markets.
However, the higher GDP growth will likely spur corporate earnings.
The earnings are expected to grow around 50% in 2010, much stronger than the emerging markets' average.
Oil prices remain at a comfortable range and have been moving sideways this year.
The record low interest rate is supportive of corporate borrowing and this in turn helps to fuel growth for capital investment and retail sales.
Although the expected earnings will not hit a new high until 2012, the RTS Index is still trading far below its all-time peak, suggesting a huge upside potential.
| Fiscal Year | 2010 | 2011 | 2012 |
| Earnings per Share (EPS) | 192.69 | 228.72 | 259.85 |
| Earnings Growth | 47.8% | 18.7% | 13.6% |
| Source: Bloomberg, iFAST compilations (as of end-Aug '10) | |||
Click on NEXT to read more...

Brazil (IBOV)
Brazil's Q2 2010 GDP went up by 8.8% y-o-y, better than the 7.9% consensus.
The Brazilian central bank projected the economy to grow by 7.1% in 2010.
Consumption which accounts for over 60% of Brazil's economy will likely become an attractive theme as reflected in the robust retail sales.
However, relevant stocks are under-represented in the Bovespa Index as the energy and material sectors take the largest pie.
Brazil will host the 2014 FIFA World Cup and 2016 Olympic Games. These international events are likely to boost infrastructure spending.| Fiscal Year | 2010 | 2011 | 2012 |
| Earnings per Share (EPS) | 5313.95 | 6869.51 | 8100.50 |
| Earnings Growth | 60.8% | 29.3% | 17.9% |
| Source: Bloomberg, iFAST compilations (as of end-Aug '10) | |||
Click on NEXT to read more...
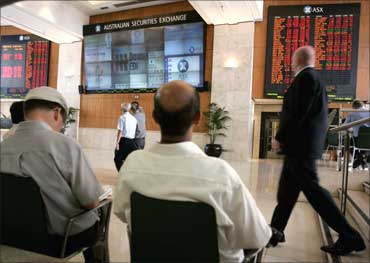
Australia (S&P/ASX 200)
The Consumer Confidence Index has risen from 101.9 in June to 119.2 in August, while the unemployment rate declined for three consecutive months to 5.1% in June.
The figures are supportive for growth in the domestic consumption sector.
The expected earnings growth for the Consumer discretionary sector in 2010 is 42.35%.
The earning growth for the overall market comes mainly from the financial sector.
The expected earnings growth for the financials sector is 102.77% in 2010.
China has always been one of the largest importers of Australian commodities. The demand from China would have a large impact on Australian miners.
The encouraging upward trend in overall imports and domestic consumption in China could further buoy the Australian equity market.
| Fiscal Year | 2010 | 2011 | 2012 |
| Earnings per Share (EPS) | 290.96 | 349.90 | 398.60 |
| Earnings Growth | 14.9% | 20.3% | 13.9% |
| Source: Bloomberg, iFAST compilations (as of end-Aug '10) | |||