Photographs: Reuters
One in seven Americans was living in poverty in 2009 with a family of four living on less than $21,954 a year, according to the US Census Bureau.
The official poverty rate in 2009 was 14.3 per cent -- up from 13.2 per cent in 2008. This was the second statistically significant annual increase in the poverty rate since 2004.
In 2009, 43.6 million people were in poverty, up from 39.8 million in 2008 -- the third consecutive annual increase in the number of people in poverty.
Between 2008 and 2009, the poverty rate increased for non-Hispanic Whites (from 8.6 per cent to 9.4 per cent), for Blacks (from 24.7 per cent to 25.8 per cent), and for Hispanics (from 23.2 per cent to 25.3 per cent). For Asians, the 2009 poverty rate (12.5 per cent) was not statistically different from the 2008 poverty rate.
The poverty rate in 2009 (14.3 per cent) was the highest poverty rate since 1994 but was 8.1 percentage points lower than the poverty rate in 1959, the first year for which poverty estimates are available.
. . .
1 in 7 Americans poor; Asians in US the richest!
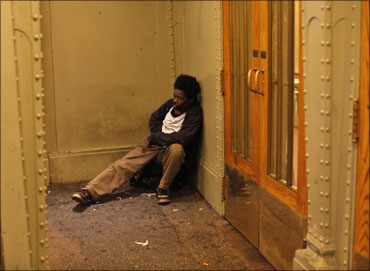
Image: A homeless man is seen in New York.Photographs: Reuters
The number of people in poverty in 2009 (43.6 million) is the largest number in the 51 years for which poverty estimates have been published.
Between 2008 and 2009, the poverty rate increased for children under the age of 18 (from 19.0 per cent to 20.7 per cent) and people aged 18 to 64 (from 11.7 per cent to 12.9 per cent), but decreased for people aged 65 and older (from 9.7 per cent to 8.9 per cent).
Asian households richest in America
Among the race groups, Asian households had the highest median income in 2009 ($65,469).
The median income for non-Hispanic-White households was $54,461; for Black households it was $32,584; and for Hispanic households it was $38,039.
Comparing the income of non-Hispanic-White households to that of other households shows that the 2009 ratio of Asian to non-Hispanic-White income was 1.20, the ratio of Black to non-Hispanic-White income was 0.60, and the ratio of Hispanic to non-Hispanic-White income was 0.70.
. . .
1 in 7 Americans poor; Asians in US the richest!
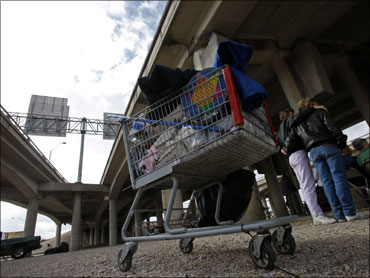
Image: A shopping cart with a homeless person's belongings is seen under an overpass in Waco, Texas.Photographs: Reuters
Between 1972 (the first year that income data for the Hispanic and non-Hispanic-White populations were collected in the CPS ASEC) and 2009, the Black-to-non-Hispanic-White income ratio increased from 0.58 to 0.60.
Over the same period, the Hispanic-to-non-Hispanic-White income ratio declined from 0.74 to 0.70. Income data for the Asian population was first available in 1987. The Asian-to-non-Hispanic White income ratios for 1987 and 2009 were not statistically different, 1.14 and 1.20, respectively.
The poverty rate and the number in poverty increased by 1.9 percentage points and 6.3 million between 2007 and 2009. The increase in the overall poverty rate was:
Larger than the increase in the poverty rate during the November 1973 to March 1975 recession.
Smaller than the increase in the poverty rates associated with the January 1980 to July 1980 and July 1981 to November 1982 combined recessions.
. . .
1 in 7 Americans poor; Asians in US the richest!
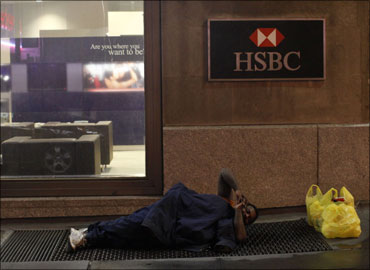
Image: A homeless man sleeps in front of an HSBC branch in New York.Photographs: Reuters
Between 2007 and 2009, the child poverty rate and the number in poverty increased by 2.7 percentage points and 2.1 million.
Number of people without health insurance rises
The percentage of people without health insurance increased to 16.7 per cent in 2009 from 15.4 per cent in 2008. The number of uninsured people increased to 50.7 million in 2009 from 46.3 million in 2008.
The number of people with health insurance decreased to 253.6 million in 2009 from 255.1 million in 2008. This is the first year that the number of people with health insurance has decreased since 1987, the first year that comparable health insurance data were collected.
The number of people covered by private health insurance decreased to 194.5 million in 2009 from 201.0 million in 2008. The number of people covered by government health insurance increased to 93.2 million in 2009 from 87.4 million in 2008.
Between 2008 and 2009, the percentage of people covered by private health insurance decreased from 66.7 per cent to 63.9 per cent. The percentage of people covered by employment-based health insurance decreased to 55.8 per cent in 2009, from 58.5 per cent in 2008.
. . .
1 in 7 Americans poor; Asians in US the richest!
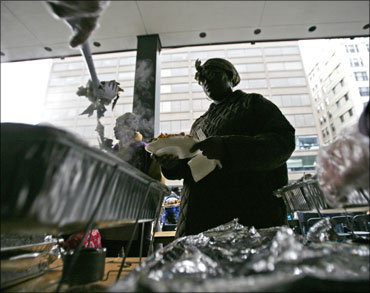
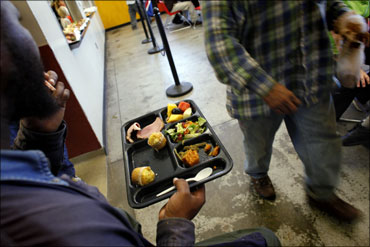
Image: A homeless man holds his plate of food at the Urban Ministry soup kitchen in Charlotte, North Carolina.Photographs: Reuters
The percentage of people covered by employment-based health insurance is the lowest since 1987, the first year that comparable health insurance data were collected.
The number of people covered by employment-based health insurance decreased to 169.7 million in 2009, from 176.3 million in 2008.
The percentage of people covered by government health insurance programs increased to 30.6 per cent in 2009, from 29.0 per cent in 2008. This is the highest percentage of people covered by government health insurance programs since 1987.
The percentage and number of people covered by Medicaid increased to 15.7 per cent or 47.8 million in 2009, from 14.1 per cent or 42.6 million in 2008. The percentage and number of people covered by Medicaid is the highest since 1987.
The percentage and number of people covered by Medicare in 2009 (14.3 per cent and 43.4 million) were not statistically different from 2008.
. . .
1 in 7 Americans poor; Asians in US the richest!
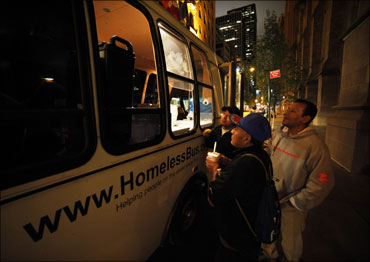
Image: Homeless people stand in line waiting to get some food.Photographs: Reuters
In 2009, 10.0 per cent of children under 18, or 7.5 million, were without health insurance. These estimates were not statistically different from the 2008 estimates.
Meanwhile, new figures showed home foreclosures in August hit the highest level since the mortgage crisis began.
"Banks repossessed 95,364 properties in August, up by 3 percent from July and an increase of 25 percent from August 2009," RealtyTrac, a company which charts the national picture, said.
The bureau's report -- Income, Poverty, and Health Insurance Coverage in the US: 2009, covers President Barack Obama's first year in office.
However, in a statement, Obama said the report 'illustrates just how tough 2009 was'.

article