
According to the data released by the government, the capital goods segment in the overall industrial output rose by 63 per cent in July and pushed up the Index of Industrial Production (IIP) by 13.8 per cent. This was almost twice analysts' expectations of industrial growth of 7.7 per cent.
Click NEXT to read on...
For instance, within the capital goods segment, estimates suggest that the insulated cable wire segment grew by over 500 per cent. But numbers from Havells, one of the largest players in the segment, paints a different picture. Ditto for turbines, electric generators and commercial vehicles. The only exception to it seems to be complete tractors.
Click NEXT to read on
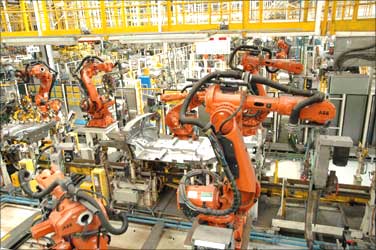
The capital goods category has a weight of around 9.3 per cent in IIP and has 54 constituents. Of the 54 items, transport and equipment contribute most to the index.
Though the automobile and allied equipment sector has indeed registered impressive double-digit growth in July, it does not support the data presented by the government.
On a month-on-month basis, IIP shows the capital goods sector grew by 42 per cent in July, which analysts said is exaggerated.
Even the Reserve Bank of India (RBI) does not seem to trust what has been dished by the Ministry of Statistics and Programme Implementation.
Click NEXT to read on

| EYEPOPPING OR EYEWASH? | |||
| Capital goods item | Weight in | Annual growth in July '10 | |
| Govt | Industry | ||
| Insulated Cable wires | 0.2 | 517.74 | 25-30 |
| Turbines | 0.21 | 67.02 | 18-20 |
| Electric generators | 0.20 | 63.46 | 15-20 |
| Commercial vehicles | 0.10 | 44.75 | 31 |
| Complete tractors | 0.46 | 12.50 | 15-20 |
| Overall capital goods | 9.30 | 63.00 | 22 |
Click NEXT to read on...
A research note by Kotak Institutional Equities suggests that if one were to apply the IIP weights to the growth obtained from increase in output of the items that constitute the capital goods index, the growth comes to about 22 per cent and not 63 per cent. Based on these calculations, the overall IIP growth projected by the Central Statistical Organisation (CSO) at 13.8 per cent comes to around 8.8 per cent for the month of July.
Click NEXT to read on...
"IIP at the detailed level is particularly very volatile. It is not clear whether the three-fold jump in production in case of wires and cables are the result of such noise or a simple data error," said Mridul Saggar, chief economist with Kotak Securities Ltd.
Havells India Joint Managing Director Anil Gupta says there has been a rise in production and sales in the industry. However it is around 20 per cent in the month of July. "Well, the increase specifically for the month of July was somewhere around 20 per cent We do feel that the overall IIP data is reliable but not so much on product to product basis," said Gupta.
Havells enjoys the second-largest market share in the cables and wires segment.
However, other major components of capital goods like tractors, passenger and other locomotives have registered growth which are somewhat comparable to corporate sale figures.
Click NEXT to read on

Similarly, for commercial vehicles, IIP shows a growth rate of 44.75 per cent in July, while the data released by the Society of Indian Automobile Manufacturers pegs commercial vehicle sales growth at 31 per cent.
Statistical low base effect has also played a role in beefing up the capital goods index as during July 2009, capital goods had registered a marginal growth rate of 1.7 per cent.
Click NEXT to read on
According to Saggar, CSO should undertake efforts to strengthen its statistical system as it guides policy decision. "The sampling procedures of factories need to be relooked into and sharp fluctuations in data need to be reconfirmed," Saggar added.